
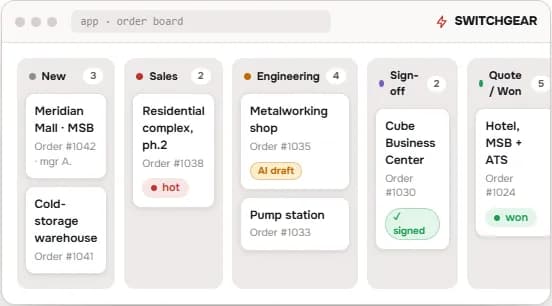
Switchgear manufacturer (name under NDA) · Low-voltage electrical panels · Italy
2 days
to a priced quote, instead of about 10
Quoted by hand. Then not.
3 weeks
UnblockSee the business

See the business
The director asks what the pipeline is worth and someone opens three files to answer. The monthly report is assembled by hand. Two departments keep two different customer lists. Decisions wait for a number that should already be on a screen.
One data model, agreed with you, that describes your business in your words. Then the screens on top of it: the director's dashboard, the catalogue with its real structure, the usage statistics that show what your team actually does. Existing systems stay and feed it.
Interactive
One total in this table is wrong. You have 30 seconds.
| Order | Quantity | Price | Total |
|---|---|---|---|
| 1041 | 12 | 18.50 | |
| 1042 | 40 | 6.25 | |
| 1043 | 7 | 64.00 | |
| 1044 | 25 | 11.40 | |
| 1045 | 18 | 23.75 | |
| 1046 | 60 | 3.80 | |
| 1047 | 9 | 47.20 | |
| 1048 | 32 | 14.60 | |
| 1049 | 15 | 29.90 | |
| 1050 | 44 | 8.15 |
1.8 h
a day the average knowledge worker spends searching for information.
McKinsey Global Institute, 201294%
of spreadsheets used for business decisions contain errors.
Poon et al., 2024Switchgear manufacturer (name under NDA) · Low-voltage electrical panels · Italy
2 days
to a priced quote, instead of about 10
3 weeks
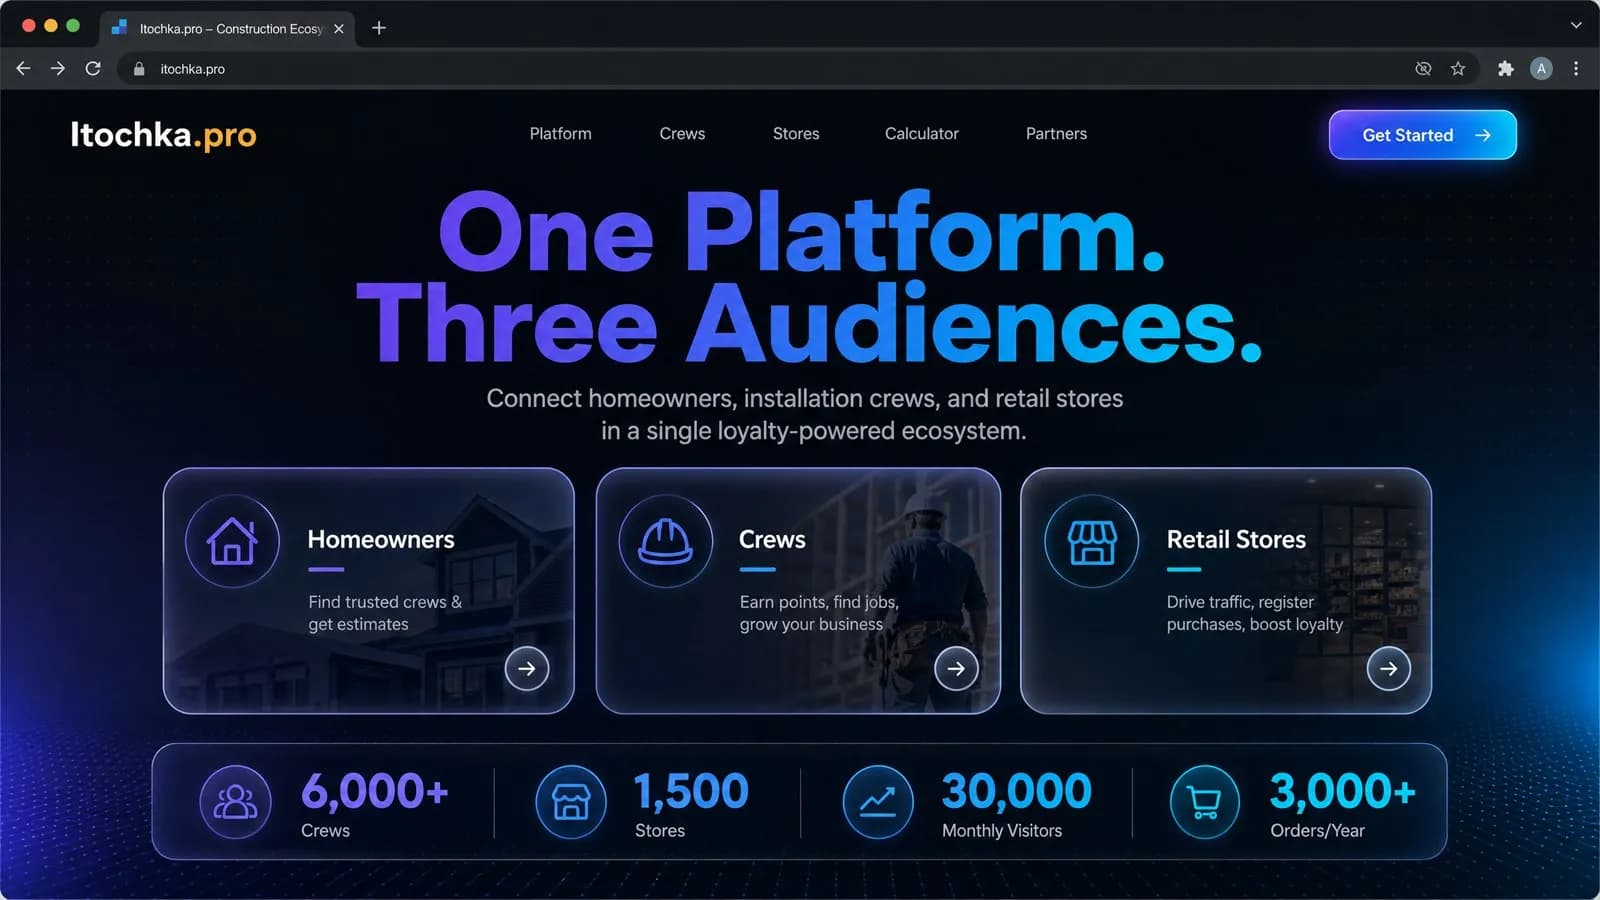
Knauf Insulation · Building materials · International
6,000
professionals and 1,500 stores on one platform
Staged: MVP → pilot → trial → production
The data model and a first dashboard within the pilot. Connections to your existing systems in the weeks after.
Thirty minutes. You describe the pain and the result you want. We ask questions. If we can help, you get one email with what we found, what we'd build and what it costs. If we can't, we'll say so.